by Srinivas Bolloju – Senior Consultant
1. Introduction & Purpose
This document covers tactical monitoring of the Oracle SOA 12c Environments.
The purpose of this document is to describe how to monitor Oracle SOA 12c platforms. At a high level, monitoring contains the following aspects:
- Monitoring of WebLogic server during startup.
- Monitoring of WebLogic after the server has started successfully.
- Application-level monitoring after the WebLogic server has started successfully.
2. WebLogic/SOA Servers Startup Monitoring
2..1 High Level Objectives
The high-level objectives of startup monitoring are to:
- Confirm that all nodes in the WebLogic cluster have started successfully.
- All the Composites are loaded successfully.
- All the Fusion Middleware Applications are in an active state.
- All the FMW Adapters are in an active state.
- There are no errors in WLS_SOA1.out and WLS_SOA2.out log files
- Detailed Monitoring Steps
2..1 Confirm WebLogic Server in “Running” state
After starting the WebLogic servers on Host1 and Host2, start monitoring the log files.
The log file location: DOMAIN_HOME/servers/WLS_SOA1/logs
Use the following command to continuously monitor the log file.
[oracle@Host1 logs]$ tail –f WLS_SOA1.out
Initially, you will see many messages and later you should see the messages below. Confirm the highlighted message shown in the below screen appears.
The message below confirms that the WebLogic server is RUNNING

If the status does not state RUNNING, check the logs in detail and take the necessary action to address the issue.
(Repeat Same on Node2)
Hostname: Host2
Loc: cd $DOMAIN_HOME/servers /servers/WLS_SOA2/logs
2..2 Confirm that the SOA-INFRA has started
As you continue to monitor the log file (using the tail –f command as seen in the 2.2.1 step) you should see the following message on the screen to indicate that the SOA server has started successfully. Confirm that the highlighted message shown in the screen below appears as it confirms the SOA-Infra is up and ready.
![]()
If you do not see the above message, then there is an issue that needs to be investigated, and appropriate action needs to be taken.
(Repeat same on Node2)
Hostname: Host2
Loc: cd $DOMAIN_HOME/servers/WLS_SOA2/logs
2..3 Confirm that the WSDL have loaded without errors
Recently we have been encountering frequent issues with the loading of composites. The symptom of this issue can be seen in the log file. The log file will show an error code of 20020. While monitoring the log file if you encounter 20020 errors you may have to stop the re-start the WLS_SOA1 and WLS_SOA2 servers.
Also, after you complete the 2.2.2 steps, run the command below and check if an SOA composite has a loading issue (error code 20020) due to WSDL load problems.

If you see any “20020” errors, those errors should be rectified.
2..4 Confirm that no Data Sources have issues
Using the steps in the Appendix, check for data source-related errors. If there are any errors, those errors should be rectified before proceeding
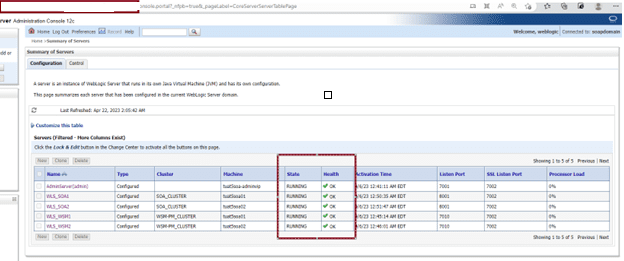
2..5 Confirm that all servers are RUNNING through Admin Console
Although the log may indicate that the servers have started successfully, we need to confirm that the servers are in a “RUNNING” state using the WebLogic Admin console. Using the credentials provided to you to login into (http://Host1:7001/console), verify that all the servers are in the “RUNNING” state.
If you do not see servers in the “RUNNING” state, using the process, inform Middleware Team about the condition you see in the log files.

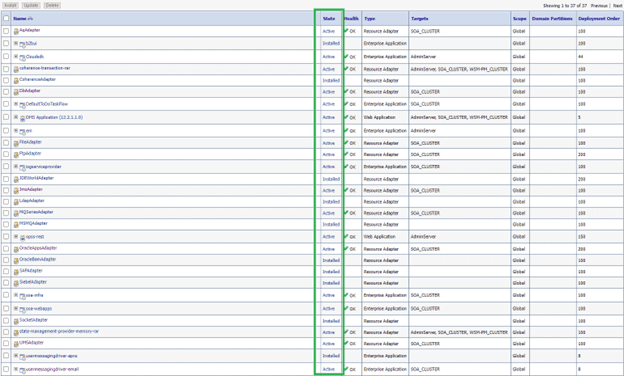
2..6 Confirm that deployments are ACTIVE
All the applications that are deployed must be in an “ACTIVE” state. When you are logged in the WebLogic, click on the deployments and check if any deployments are not in the “ACTIVE” state.


Again, if you see any deployments not in ACTIVE i.e. UNKNOWN / FAILED state, inform the Middleware team about the condition you see in the log files.
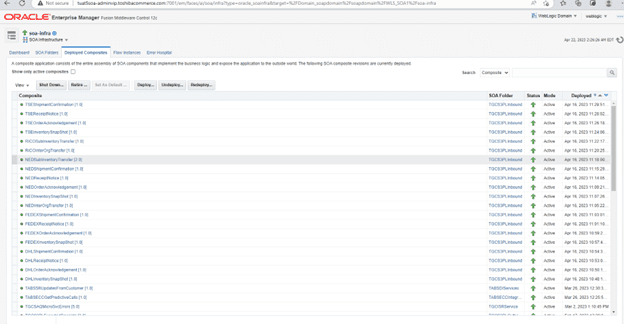
2..7 Confirm that all composites are loaded
As a final step, you will need to ensure that all the composites are loaded successfully. This can be checked by logging into the FMW OEM console (http://Host1:7001/em). After you login into the EM console follow the steps mentioned below to check for any failed composites.
- Login to the EM console
- For the WLS_SOA1 server, expand SOA, click on soa-infra, and right-click on soa-infra. Deployed Composites have a non-green status. An SOA composite may be retired or shutdown intentionally. For a list of Composites that have been taken down intentionally please contact your development team

- Check for the red icon next to the composite as shown below. This is caused when the composite is not loaded.
- Repeat these steps for each WLS_SOA2 server
- Again, if you see any deployments not in an ACTIVE state, please take the appropriate action.
3. Oracle Weblogic SOA – Run time Monitoring
After the Team confirms that the SOA has started successfully, we need to check that the WebLogic & the SOA/FMW continues to run without any issues. Please use the steps mentioned below to monitor the health of the server. Please make sure to run these steps every hour.
3..1 Report Composite Count
We will need to monitor that the composites are loaded successfully and that they do not go down after startup.
Login to EM Console and provide the current screenshot of the EM. The screen will show how many composites are loaded and how many are down. Please ensure that the count is the same every time (note: check that number of retired shut down and active are the same as before restart).
3..2 Report Server status
After the startup, there may be events that cause the server to go down. Please login to the WebLogic Console and provide the screenshot of the current Server Status.

- Report Storage Status
There are situations where the storage may fill up due to logs or other failures that may cause the WebLogic to go-down. Please use following steps to verify that there is adequate storage:
- Login to Host1.com and execute the below command to find the Storage Status of the Server
- After login execute df -kh on Host1 and Host2
[oracle@Host1 logs]$ df -kh
[oracle@Host2 logs]$ df -kh
- Report Memory Status
We will also need to ensure that there are no issues due to memory. If total memory free is below 85% report the status.
3..1 Report Cumulative Heap Size
Report total heap size of all the WebLogic JVM for all the environments. The cumulative will be constant; however, will change if the heap sizes are increased or if we add more environments.
3..2 Run Free -m
[oracle@Host1 logs]$ free -m
total used free shared buffers cached
Mem: 39964 39001 963 16 383 15369
-/+ buffers/cache: 23248 16716
Swap: 20479 104 20375
[oracle@Host1 logs]$
[oracle@Host1 logs]$ free -g
total used free shared buffers cached
Mem: 39 36 2 0 0 21
-/+ buffers/cache: 14 24
Swap: 19 0 19
[oracle@Host1 logs]$
Definition of top line:
total = all memory in the system
used = all memory currently in use/reserved by running processes and the OS
free = total – used
shared = memory being shared by multiple processes
buffers = memory reserved by the OS to allot as buffers when process need them
cached = recently used files being stored in RAM
Calculate “used memory” and “free memory” using the above definition
Free memory = free + buffers + cached
Used Memory = used – (buffer + cached)
Cached memory is also free memory and available for use by the application. The kernel keeps a large chunk of memory as cached to save the swapping time and run the applications faster.
3..3 Check Garbage Collection (GC)
Check the garbage-collection log files to find out how many times Full GC took place during the past hour. If found, then mention them in the status report.
Again, if you see any abnormal conditions like report below, please report the status:
- Out of memory errors (This may also show up in Managed Servers)
- Frequent Full Garbage Collection
3..3.1 Check of GC for SOA Managed server (WLS_SOA1 and WLS_SOA2)
- Report for both Host1 & Host2 by logging in user=oracle
cd $DOMAIN_HOME
ls -lrt |grep GC
[oracle@xxxxxxxxxxx soapdomain]$ pwd
$DOMAIN_HOME
[oracle@xxxxxxxxxxx soapdomain]$ ls -ltr |grep GC
-rw-r—– 1 oracle dba 10485926 Mar 24 13:49 GC_WLS_SOA2.log.0
-rw-r—– 1 oracle dba 1344267 Mar 27 03:45 GC_WLS_SOA2.log.1.current
-rw-r—– 1 oracle dba 10487249 Mar 29 00:18 GC_WLS_SOA1.log.0
-rw-r—– 1 oracle dba 10486061 Mar 30 17:58 GC_WLS_SOA1.log.1
-rw-r—– 1 oracle dba 10486945 Apr 1 11:48 GC_WLS_SOA1.log.2
-rw-r—– 1 oracle dba 10487049 Apr 3 05:38 GC_WLS_SOA1.log.3
-rw-r—– 1 oracle dba 10286894 Apr 4 22:40 GC_WLS_SOA1.log.4.current
-rw-r—– 1 oracle dba 5396425 Apr 22 02:52 GC_WLS_SOA2.log.0.current
-rw-r—– 1 oracle dba 9455261 Apr 22 02:53 GC_WLS_SOA1.log.0.current (ß One with latest time stamp is current file)
view GC_WLS_SOA1.log.0.current
Node-2
cd $DOMAIN_HOME
ls -lrt |grep GC
[oracle@xxxxxxxxxxx soapdomain]$ pwd
$DOMAIN_HOME
[oracle@xxxxxxxxxxx soapdomain]$ ls -ltr |grep GC
-rw-r—– 1 oracle dba 10485926 Mar 24 13:49 GC_WLS_SOA2.log.0
-rw-r—– 1 oracle dba 1344267 Mar 27 03:45 GC_WLS_SOA2.log.1.current
-rw-r—– 1 oracle dba 10487249 Mar 29 00:18 GC_WLS_SOA1.log.0
-rw-r—– 1 oracle dba 10486061 Mar 30 17:58 GC_WLS_SOA1.log.1
-rw-r—– 1 oracle dba 10486945 Apr 1 11:48 GC_WLS_SOA1.log.2
-rw-r—– 1 oracle dba 10487049 Apr 3 05:38 GC_WLS_SOA1.log.3
-rw-r—– 1 oracle dba 10286894 Apr 4 22:40 GC_WLS_SOA1.log.4.current
-rw-r—– 1 oracle dba 5396425 Apr 22 02:52 GC_WLS_SOA2.log.0.current ß One with latest time stamp is current file
-rw-r—– 1 oracle dba 9455261 Apr 22 02:53 GC_WLS_SOA1.log.0.current
view GC_WLS_SOA2.log.0.current
3..3.2 Check for GC for Admin Server
- AdminServer: Login to Host1 as user=oracle
cd $DOMAIN_HOME
ls -lrt |grep GC_AdminServer.log
3..4 Below Needs Attention
- Composites are not active
- Deployments are not active
- Memory used is over 80 to 85%
- Storage is getting over the threshold: 90%
Appendix A
- How to Verify if soa-infra is UP
WLS_SOA1 and WLS_SOA2
Logon to Host1 | 2 (user=oracle)
cd $DOMAIN_HOME/servers/WLS_SOA1/logs
cat WLS_SOA1.out |grep “SOA Platform ”
SOA Platform is running and accepting requests
cd $DOMAIN_HOME /servers/WLS_SOA2/logs
WLS_SOA2.out |grep “SOA Platform ”
Note: Repeat for xxxxxxxxxxx.yyyyyyyyy.com
- How to Verify if Data Source Issues
WLS_SOA1 and WLS_SOA2 – one node is fine to do
Logon to xxxxxxxxxxx.yyyyyyyyy.com |2 (user=oracle)
cd $DOMAIN_HOME/servers/WLS_SOA1/logs
cat WLS_SOA1.out |grep JDBC |grep BEA-001129
cd $DOMAIN_HOME /servers/WLS_SOA2/logs
cat WLS_SOA2.out |grep JDBC |grep BEA-001129
Note: Repeat for xxxxxxxxxxx.yyyyyyyyy.com
Note: If the above command returns any lines … then report Output to the Developers and MWA .. using below command … this will give unique Data Sources having issues.
cat WLS_SOA1.out |grep JDBC |grep BEA-001129 |awk ‘{print $17}’ |sort -u -t, -k1,1
cat WLS_SOA2.out |grep JDBC |grep BEA-001129 |awk ‘{print $17}’ |sort -u -t, -k1,1
Note: if Datasource is related to (“mds-soa”,”OraSDPMDataSource”,”SOALocalTxDataSource”,mds-owsm,OPSS) — this must be resolved before releasing
- How to Verify if Composites Loaded Fine
WLS_SOA1 and WLS_SOA2
Logon to usa0300lv840|1 (user=oracle)
cd $DOMAIN_HOME/servers/WLS_SOA1/logs
cat WLS_SOA1.out |grep 20020
Optimize Your Oracle SOA 12c Environment with Monitoring and Health Checks
Unlock the full potential of your Oracle SOA 12c deployment by implementing powerful monitoring and health-check strategies. For personalized guidance, additional insights, or any questions you may have, reach out to the author directly or contact our office.
Srinivas Bolloju – Senior Consultant
Email: [email protected]
