by Fred Tingle – Principal Architect
In Part One of this series, we discussed how to detect long-running programs and code to improve the performance of EBS Applications. In Part Two, we looked at the OS for the Application Database Tiers to identify and address queries that cause high CPU utilization and impact overall performance.
Now, in Part 3, we will discuss how to tune your application’s WebLogic tier to address performance issues.
Review the steps below to begin tuning your application WebLogic tier. These steps not only address WebLogic impacts, but also assess other factors such as memory consumption, CPU usage, server load, and wait times.
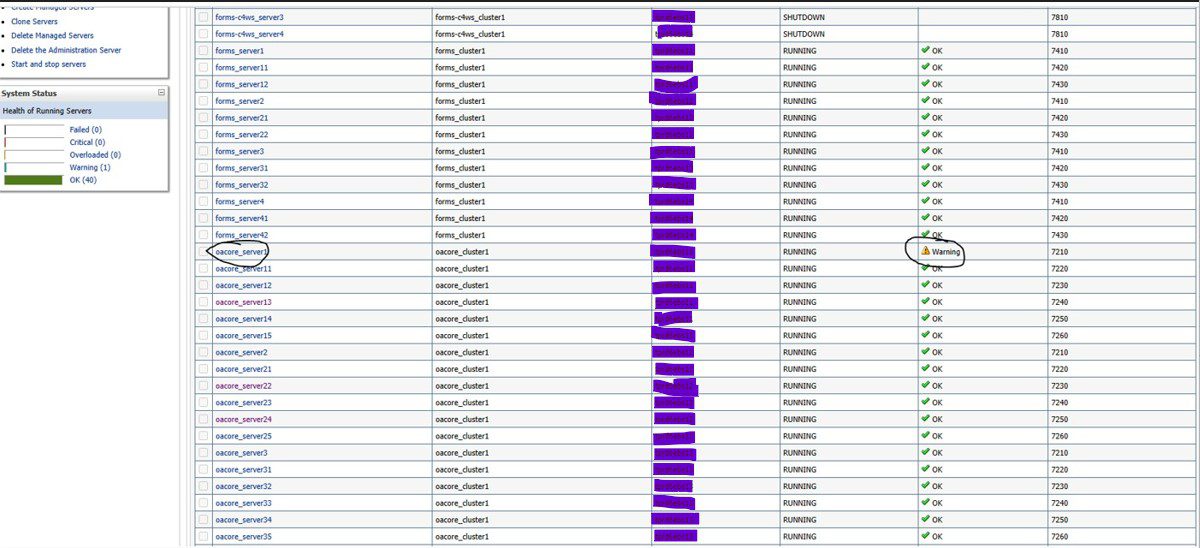
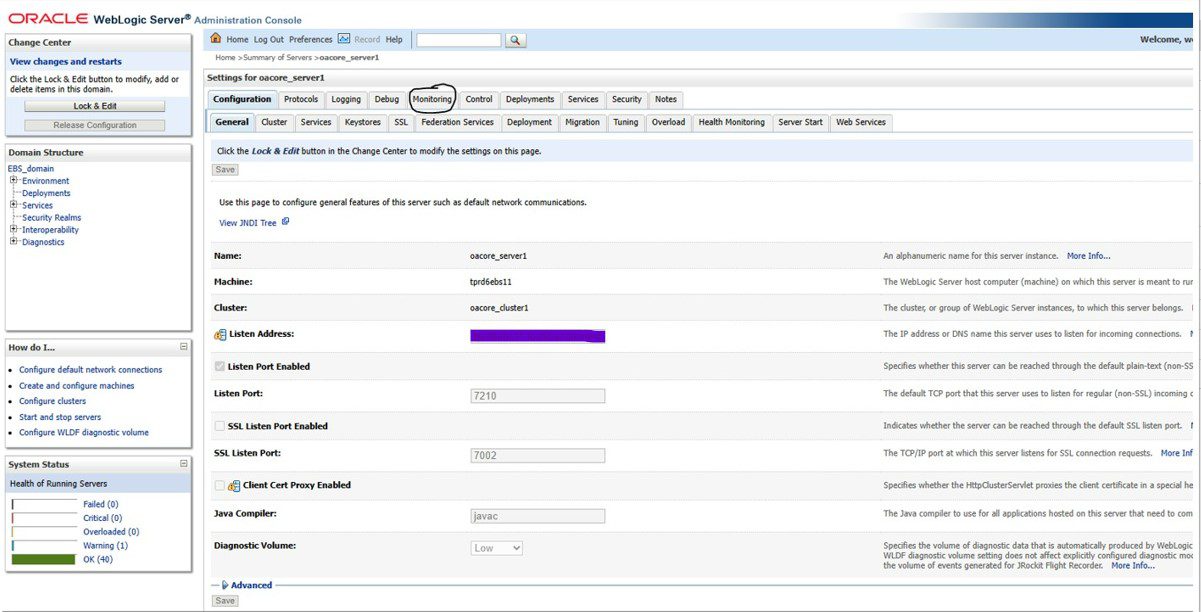
To begin tuning the Application Tier, it is advisable to start with WebLogic. A crucial aspect to focus on is the stuck thread process, which occurs in the oacore layer. When an oacore enters warning mode, it is typically associated with a user session retrieving data from the database. To investigate this, access the WebLogic console and examine the health status of each oacore. If any warnings are detected, you can click on the specific oacore name to gain more insight. Proceed to the monitor tab, and within that section, click on the thread tab, as illustrated below.
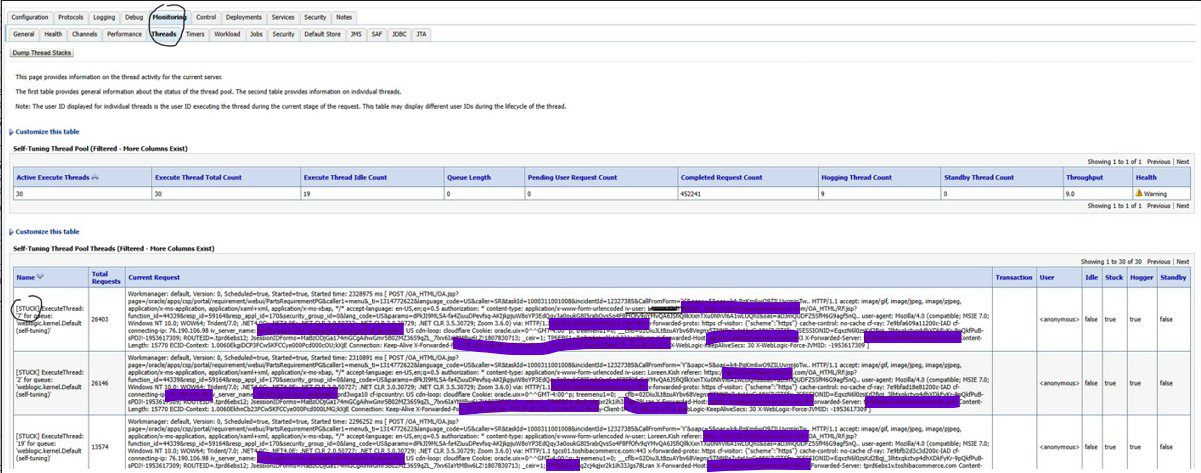
Once you have obtained the ID mentioned above, you can proceed to execute the following query to identify the code that is currently being executed by the user:
Query used below:
select
a.inst_id,
sqlarea.sql_id,
a.sid,
a.serial#,
–p.spid,
a.logon_time,
a.last_call_et/60,
a.username,
a.status,
a.machine,
a.module,
a.program,
a.action,
a.event,
a.client_identifier,
sql_text
from gv$sqlarea sqlarea, gv$session a–,
–gv$process p
where a.sql_hash_value= sqlarea.hash_value(+)
and a.sql_address= sqlarea.address(+)
–and p.addr = a.paddr
and a.username is not null
and a.client_identifier like ‘%USERID%’
order by a.client_identifier
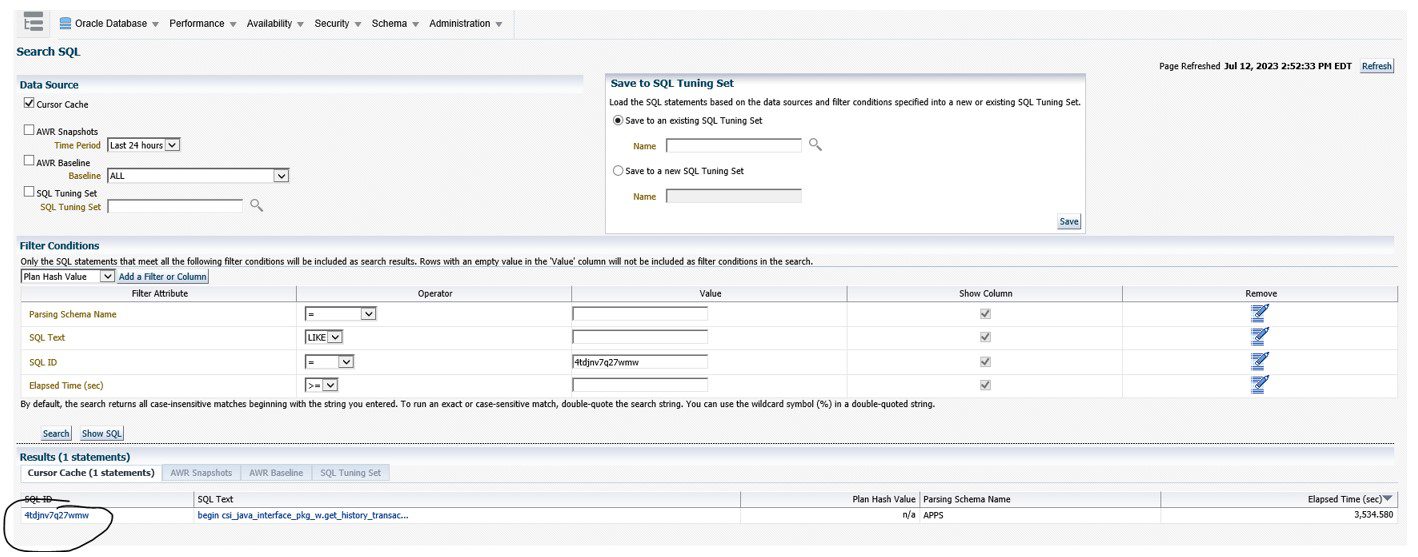
The provided output displays both active and inactive sessions of the user. To proceed with Tuning Advisor, you need to extract the SQL ID from the active session and then use it to run through the Tuning Advisor tool for potential recommendations.

It is crucial to perform thorough testing of any Tuning Advisor recommendations in non-production environments before implementing them in a live production system. Lower instances should be utilized for this testing to assess the potential impact of the changes accurately.
Additionally, before proceeding with index creations on core tables, a careful evaluation of their effects on the system’s tables and transactions is necessary. Understanding the impact of these changes will help ensure the overall stability and performance of the system during and after the implementation process.
Take the first step towards a faster and more efficient system!
Don’t let performance issues slow you down. Reach out to us today! Contact the author directly or get in touch with our office to learn how to tune your application’s WebLogic tier to address performance issues.
Fred Tingle – Principal Architect
Email: [email protected]
Cell: 563-607-1555
LinkedIn: linkedin.com/in/fred-tingle-2046857


